White-naped Honeyeater
Melithreptus lunatus
ABR description
The following is extracted from the Annual Bird Report for the twelve months to June 2017.
Common, breeding resident/summer migrant
Migratory, flocks departing in autumn, occasional overwintering, and returning in spring to breed in the mountain forests.
General: Number of records higher than last year and reporting rate slightly above last year’s record low but still less than half the 30YA. Fewer records in winter this year than last year (19%) with most records in spring (42%). The return migration in spring contained a few large flocks including the year’s maximum 80/22 Sep Athllon Drive (FrM1). Autumn migration was first noted with a few small flocks in the first week of April, typical for this species. Mean 6.2, median 3. 6 breeding records: first on/1 Jan Booroomba Rocks (SmA1), last dy/8 Feb Tallaganda NP (DaC2).
GBS: 69 records is above the 58 of last year, but still only about half the 30YA. No records in July, only 1 in Aug, but sudden start to return migration 25/1wk Sept in Duffy. Unusually, the number of records continued strongly through Oct and even into 1wk Dec at 1 site in Weston. Then no records until autumn migration started 1wk Apr. Max 100/5wk Apr Jerrabomberra (HaL2). Abundance (A=0.2177) was marginally higher than last year but still only about half of the 30YA. Since the last peak of A=1 in 1999, A values have usually been between 0.1 and 0.2.

Abundance
Abundance is the average number of birds of that species per survey. Where the species was observed (presence recorded) but the number of birds seen was not recorded, this is treated as a count of zero.
Abundance by year
This chart shows the abundance of White-naped Honeyeater between 1982 and 2017. 
Abundance by month
This chart shows the monthly abundance of White-naped Honeyeater. The blue lines show the abundance for the twelve months to June 2017 and the bars show the average abundance for the period 1982 to 2017. 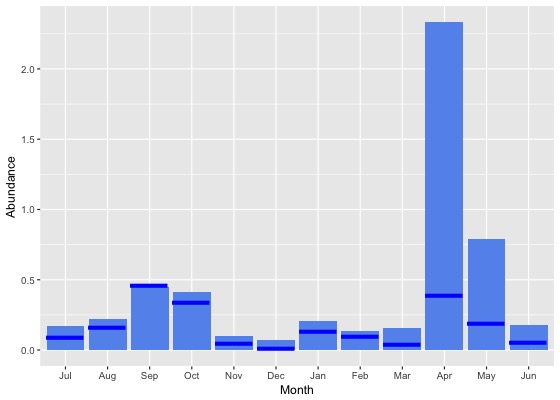
Abundance by season
This chart shows the seasonal abundance of White-naped Honeyeater. The blue lines show the seasonal abundance for the twelve months to June 2017 and the bars show the average seasonal abundance for the period 1982 to 2017. 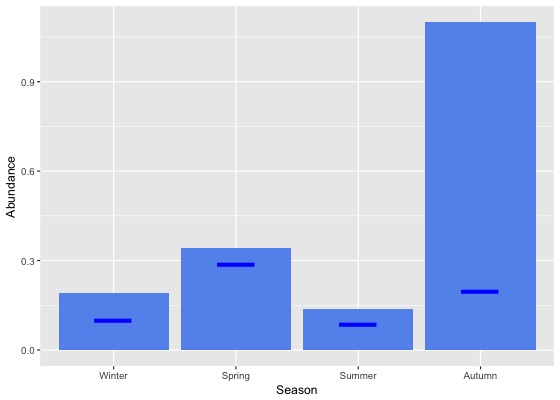
Abundance data
| Month | Season | ||||||||||||||||||
|---|---|---|---|---|---|---|---|---|---|---|---|---|---|---|---|---|---|---|---|
| Period | Jul | Aug | Sep | Oct | Nov | Dec | Jan | Feb | Mar | Apr | May | Jun | Winter | Spring | Summer | Autumn | All | ||
| All years | |||||||||||||||||||
| All | 0.2 | 0.2 | 0.4 | 0.4 | 0.1 | 0.1 | 0.2 | 0.1 | 0.2 | 2.3 | 0.8 | 0.2 | 0.2 | 0.3 | 0.1 | 1.1 | 0.4 | ||
| Previous years | |||||||||||||||||||
| All previous years | 0.2 | 0.2 | 0.4 | 0.4 | 0.1 | 0.1 | 0.2 | 0.1 | 0.2 | 2.6 | 0.9 | 0.2 | 0.2 | 0.3 | 0.1 | 1.3 | 0.5 | ||
| Previous 30 years | 0.2 | 0.2 | 0.4 | 0.4 | 0.1 | 0.1 | 0.2 | 0.1 | 0.2 | 2.7 | 0.9 | 0.2 | 0.2 | 0.3 | 0.1 | 1.3 | 0.5 | ||
| Previous 20 years | 0.2 | 0.2 | 0.4 | 0.4 | 0.1 | 0.1 | 0.2 | 0.1 | 0.2 | 2.9 | 0.8 | 0.2 | 0.2 | 0.3 | 0.1 | 1.3 | 0.5 | ||
| 10 year groups | |||||||||||||||||||
| [2007,2017) | 0.2 | 0.2 | 0.2 | 0.5 | 0.1 | 0.1 | 0.2 | 0.1 | 0.1 | 1.3 | 0.7 | 0.1 | 0.2 | 0.3 | 0.1 | 0.7 | 0.3 | ||
| [1997,2007) | 0.1 | 0.2 | 0.9 | 0.4 | 0.1 | 0.0 | 0.2 | 0.2 | 0.2 | 7.0 | 1.1 | 0.3 | 0.2 | 0.5 | 0.1 | 2.8 | 0.9 | ||
| [1987,1997) | 0.2 | 0.3 | 0.5 | 0.3 | 0.2 | 0.2 | 0.3 | 0.3 | 0.3 | 1.8 | 1.3 | 0.3 | 0.3 | 0.4 | 0.3 | 1.1 | 0.5 | ||
| 5 year groups | |||||||||||||||||||
| [2012,2017) | 0.1 | 0.2 | 0.1 | 0.4 | 0.0 | 0.0 | 0.1 | 0.1 | 0.1 | 0.9 | 0.7 | 0.1 | 0.2 | 0.2 | 0.1 | 0.6 | 0.2 | ||
| [2007,2012) | 0.5 | 0.3 | 0.3 | 0.7 | 0.2 | 0.1 | 0.4 | 0.2 | 0.1 | 2.0 | 0.9 | 0.1 | 0.3 | 0.5 | 0.2 | 1.1 | 0.5 | ||
| [2002,2007) | 0.1 | 0.3 | 1.2 | 0.4 | 0.1 | 0.0 | 0.2 | 0.2 | 0.3 | 5.8 | 0.8 | 0.3 | 0.2 | 0.6 | 0.1 | 2.2 | 0.8 | ||
| [1997,2002) | 0.2 | 0.1 | 0.7 | 0.3 | 0.1 | 0.0 | 0.3 | 0.2 | 0.2 | 8.5 | 1.5 | 0.3 | 0.2 | 0.4 | 0.2 | 3.4 | 1.1 | ||
| [1992,1997) | 0.1 | 0.3 | 0.9 | 0.5 | 0.2 | 0.3 | 0.5 | 0.5 | 0.5 | 3.7 | 2.9 | 0.3 | 0.3 | 0.5 | 0.4 | 2.4 | 0.9 | ||
| [1987,1992) | 0.2 | 0.3 | 0.4 | 0.2 | 0.2 | 0.2 | 0.2 | 0.2 | 0.2 | 0.7 | 0.5 | 0.3 | 0.3 | 0.3 | 0.2 | 0.4 | 0.3 | ||
| Year | |||||||||||||||||||
| 2017 | 0.1 | 0.2 | 0.5 | 0.3 | 0.0 | 0.0 | 0.1 | 0.1 | 0.0 | 0.4 | 0.2 | 0.1 | 0.1 | 0.3 | 0.1 | 0.2 | 0.2 | ||
| 2016 | 0.2 | 0.2 | 0.1 | 0.4 | 0.0 | 0.0 | 0.1 | 0.1 | 0.0 | 0.8 | 0.4 | 0.1 | 0.1 | 0.2 | 0.1 | 0.4 | 0.2 | ||
| 2015 | 0.2 | 0.2 | 0.2 | 0.3 | 0.0 | 0.1 | 0.1 | 0.1 | 0.1 | 0.8 | 0.4 | 0.0 | 0.1 | 0.2 | 0.1 | 0.4 | 0.2 | ||
| 2014 | 0.1 | 0.4 | 0.1 | 0.3 | 0.0 | 0.1 | 0.3 | 0.1 | 0.5 | 0.9 | 1.5 | 0.5 | 0.4 | 0.2 | 0.2 | 0.9 | 0.4 | ||
| 2013 | 0.1 | 0.0 | 0.1 | 0.4 | 0.0 | 0.0 | 0.0 | 0.1 | 0.0 | 2.0 | 0.2 | 0.0 | 0.0 | 0.2 | 0.0 | 0.8 | 0.3 | ||
| 2012 | 0.1 | 0.1 | 0.1 | 0.4 | 0.0 | 0.0 | 0.1 | 0.0 | 0.1 | 0.5 | 2.1 | 0.1 | 0.1 | 0.2 | 0.0 | 0.7 | 0.2 | ||
| 2011 | 0.3 | 0.2 | 0.3 | 0.3 | 0.1 | 0.0 | 0.2 | 0.0 | 0.0 | 1.0 | 0.1 | 0.0 | 0.1 | 0.3 | 0.1 | 0.4 | 0.2 | ||
| 2010 | 0.0 | 0.0 | 0.0 | 0.7 | 0.1 | 0.1 | 0.2 | 0.4 | 0.0 | 2.9 | 3.3 | 0.1 | 0.1 | 0.4 | 0.1 | 1.7 | 0.6 | ||
| 2009 | 1.3 | 0.7 | 0.5 | 1.0 | 0.4 | 0.1 | 0.4 | 0.3 | 0.1 | 0.9 | 0.8 | 0.0 | 0.5 | 0.7 | 0.3 | 0.6 | 0.6 | ||
| 2008 | 0.1 | 0.0 | 0.2 | 0.5 | 0.2 | 0.4 | 1.1 | 0.2 | 0.1 | 1.1 | 1.5 | 0.5 | 0.2 | 0.4 | 0.5 | 0.9 | 0.5 | ||
| 2007 | 1.0 | 0.9 | 0.3 | 0.8 | 0.0 | 0.1 | 0.5 | 0.6 | 0.2 | 5.0 | 0.1 | 0.0 | 0.4 | 0.5 | 0.4 | 2.1 | 0.8 | ||
| 2006 | 0.1 | 0.5 | 0.3 | 0.7 | 0.1 | 0.0 | 0.2 | 0.0 | 0.2 | 6.0 | 0.7 | 0.4 | 0.3 | 0.5 | 0.1 | 1.9 | 0.7 | ||
| 2005 | 0.2 | 0.2 | 0.1 | 0.2 | 0.1 | 0.1 | 0.4 | 0.7 | 0.1 | 3.3 | 0.4 | 0.1 | 0.2 | 0.1 | 0.3 | 1.2 | 0.5 | ||
| 2004 | 0.1 | 0.1 | 5.5 | 0.7 | 0.3 | 0.1 | 0.1 | 0.2 | 0.5 | 8.7 | 1.9 | 0.1 | 0.1 | 2.4 | 0.1 | 3.9 | 1.6 | ||
| 2003 | 0.0 | 0.5 | 0.3 | 0.0 | 0.0 | 0.0 | 0.1 | 0.0 | 0.6 | 8.1 | 0.8 | 0.4 | 0.3 | 0.1 | 0.0 | 3.5 | 1.0 | ||
| 2002 | 0.0 | 0.2 | 0.2 | 0.1 | 0.1 | 0.0 | 0.0 | 0.1 | 0.0 | 2.0 | 0.6 | 0.5 | 0.2 | 0.1 | 0.0 | 0.9 | 0.3 | ||
| 2001 | 0.2 | 0.1 | 0.5 | 0.6 | 0.0 | 0.1 | 0.3 | 0.4 | 0.1 | 20.9 | 1.5 | 0.0 | 0.1 | 0.4 | 0.3 | 6.5 | 1.9 | ||
| 2000 | 0.2 | 0.3 | 0.3 | 0.1 | 0.2 | 0.0 | 0.2 | 0.1 | 0.2 | 6.2 | 1.7 | 0.4 | 0.3 | 0.2 | 0.1 | 2.8 | 0.8 | ||
| 1999 | 0.0 | 0.1 | 1.8 | 0.3 | 0.2 | 0.0 | 0.6 | 0.2 | 0.4 | 4.1 | 1.8 | 0.8 | 0.5 | 0.8 | 0.2 | 2.2 | 1.0 | ||
| 1998 | 0.0 | 0.1 | 0.6 | 0.0 | 0.0 | 0.0 | 0.1 | 0.3 | 0.1 | 0.0 | 0.0 | 0.0 | 0.0 | 0.2 | 0.1 | 0.0 | 0.1 | ||
| 1997 | 0.1 | 0.1 | 0.1 | 0.6 | 0.0 | 0.0 | 0.2 | 0.0 | 0.1 | 1.1 | 0.2 | 0.0 | 0.1 | 0.2 | 0.0 | 0.7 | 0.2 | ||
| 1996 | 0.1 | 0.4 | 0.4 | 0.1 | 0.0 | 0.1 | 0.1 | 1.1 | 0.3 | 3.0 | 0.7 | 0.1 | 0.2 | 0.2 | 0.4 | 1.2 | 0.4 | ||
| 1995 | 0.0 | 0.1 | 0.1 | 0.1 | 0.6 | 0.3 | 0.3 | 0.1 | 0.0 | 3.6 | 8.1 | 0.9 | 0.3 | 0.2 | 0.3 | 3.6 | 1.1 | ||
| 1994 | 0.1 | 0.4 | 0.0 | 0.5 | 0.0 | 1.3 | 1.6 | 0.4 | 1.7 | 4.8 | 2.1 | 0.0 | 0.2 | 0.2 | 1.1 | 3.2 | 1.2 | ||
| 1993 | 0.3 | 0.8 | 3.8 | 0.3 | 0.1 | 0.1 | 0.9 | 0.0 | 0.5 | 1.6 | 0.8 | 0.6 | 0.6 | 1.3 | 0.4 | 0.9 | 0.8 | ||
| 1992 | 0.2 | 0.0 | 1.1 | 1.7 | 0.4 | 0.0 | 0.3 | 0.2 | 0.4 | 4.4 | 2.2 | 0.0 | 0.1 | 1.1 | 0.2 | 2.2 | 1.0 | ||
| 1991 | 0.3 | 0.9 | 0.6 | 0.3 | 1.1 | 0.0 | 0.1 | 0.6 | 0.2 | 2.6 | 0.5 | 0.0 | 0.5 | 0.7 | 0.2 | 1.1 | 0.6 | ||
| 1990 | 0.1 | 0.1 | 0.3 | 0.1 | 0.1 | 0.2 | 0.1 | 0.1 | 0.3 | 1.5 | 1.4 | 1.0 | 0.2 | 0.2 | 0.1 | 1.0 | 0.4 | ||
| 1989 | 0.1 | 0.2 | 0.5 | 0.4 | 0.2 | 0.3 | 0.2 | 0.2 | 0.2 | 0.4 | 0.3 | 0.1 | 0.2 | 0.3 | 0.2 | 0.3 | 0.3 | ||
| 1988 | 0.2 | 0.3 | 0.3 | 0.2 | 0.1 | 0.2 | 0.2 | 0.1 | 0.2 | 0.4 | 0.4 | 0.3 | 0.3 | 0.2 | 0.2 | 0.3 | 0.3 | ||
| 1987 | 0.2 | 0.1 | 0.2 | 0.1 | 0.2 | 0.1 | 0.1 | 0.1 | 0.1 | 0.4 | 0.3 | 0.3 | 0.3 | 0.2 | 0.1 | 0.3 | 0.2 | ||
| 1986 | 0.1 | 0.0 | 1.9 | 0.2 | 0.1 | 0.0 | 0.0 | 0.0 | 0.1 | 0.2 | 3.2 | 0.3 | 0.1 | 0.8 | 0.0 | 0.9 | 0.5 | ||
| 1985 | 0.0 | 0.1 | 0.1 | 0.1 | 0.0 | 0.0 | 0.0 | 0.0 | 0.0 | 0.0 | 0.0 | 0.8 | 0.3 | 0.1 | 0.0 | 0.0 | 0.1 | ||
| 1984 | 0.0 | 0.0 | 0.0 | 0.0 | 0.0 | 0.0 | 0.0 | 0.0 | 0.1 | 0.1 | 0.1 | 0.2 | 0.1 | 0.0 | 0.0 | 0.1 | 0.1 | ||
| 1983 | 0.0 | 0.0 | 0.0 | 0.0 | 0.0 | 0.0 | 0.0 | 0.0 | 0.0 | - | 0.0 | 0.0 | 0.0 | 0.0 | 0.0 | 0.0 | 0.0 | ||
| 1982 | - | 0.0 | - | 0.0 | 0.0 | 0.0 | - | 0.0 | - | 0.0 | - | 0.0 | 0.0 | 0.0 | 0.0 | 0.0 | 0.0 | ||
Reporting rates
Reporting rate is the proportion of all surveys in which the species was present.
Reporting rate by year
This chart shows the reporting rate of White-naped Honeyeater each year between 1982 and 2017. 
Reporting rate by month
This chart shows the reporting rate by month of White-naped Honeyeater. The blue lines show the reporting rate for the twelve months to June 2017 and the bars show the average reporting rate for the period 1982 to 2017. 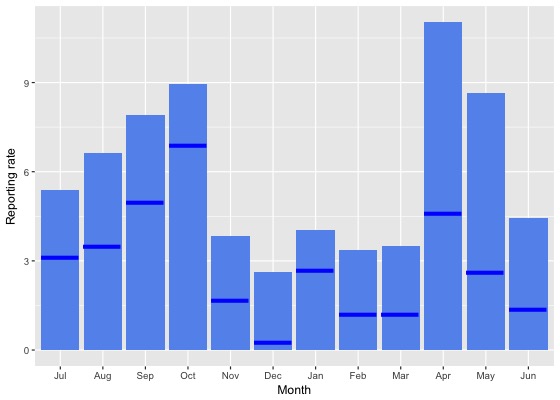
Reporting rate by season
This chart shows the seasonal reporting rate of White-naped Honeyeater. The blue lines show the seasonal reporting rate for the twelve months to June 2017 and the bars show the average seasonal reporting rate for the period 1982 to 2017. 
Reporting rate data
| Month | Season | ||||||||||||||||||
|---|---|---|---|---|---|---|---|---|---|---|---|---|---|---|---|---|---|---|---|
| Period | Jul | Aug | Sep | Oct | Nov | Dec | Jan | Feb | Mar | Apr | May | Jun | Winter | Spring | Summer | Autumn | All | ||
| All years | |||||||||||||||||||
| All | 5.4 | 6.6 | 7.9 | 9.0 | 3.8 | 2.6 | 4.0 | 3.4 | 3.5 | 11.0 | 8.7 | 4.5 | 5.4 | 7.2 | 3.4 | 7.5 | 6.0 | ||
| Previous years | |||||||||||||||||||
| All previous years | 5.7 | 7.2 | 8.3 | 9.2 | 4.2 | 3.0 | 4.3 | 3.8 | 3.9 | 12.1 | 10.1 | 5.1 | 5.9 | 7.6 | 3.7 | 8.4 | 6.5 | ||
| Previous 30 years | 5.8 | 7.3 | 8.3 | 9.3 | 4.2 | 3.0 | 4.3 | 3.9 | 3.9 | 12.0 | 10.0 | 5.0 | 5.9 | 7.6 | 3.7 | 8.4 | 6.5 | ||
| Previous 20 years | 4.5 | 4.8 | 5.4 | 8.2 | 2.1 | 1.4 | 3.0 | 2.4 | 2.6 | 9.3 | 6.4 | 3.4 | 4.1 | 5.8 | 2.3 | 6.0 | 4.6 | ||
| 10 year groups | |||||||||||||||||||
| [2007,2017) | 4.2 | 3.7 | 3.8 | 7.9 | 1.5 | 1.5 | 2.7 | 2.1 | 2.1 | 8.0 | 5.1 | 2.5 | 3.3 | 5.2 | 2.1 | 5.0 | 4.0 | ||
| [1997,2007) | 5.1 | 7.1 | 8.5 | 9.2 | 3.5 | 1.3 | 4.0 | 3.3 | 3.6 | 12.6 | 9.7 | 5.4 | 5.8 | 7.3 | 2.6 | 8.1 | 6.0 | ||
| [1987,1997) | 10.1 | 15.1 | 23.6 | 16.1 | 11.1 | 11.9 | 12.3 | 10.9 | 11.4 | 26.4 | 23.2 | 13.2 | 12.9 | 16.4 | 11.7 | 20.3 | 15.5 | ||
| 5 year groups | |||||||||||||||||||
| [2012,2017) | 3.3 | 3.3 | 2.9 | 5.9 | 0.7 | 1.2 | 2.4 | 1.6 | 1.8 | 7.0 | 4.4 | 2.4 | 3.0 | 3.7 | 1.8 | 4.3 | 3.2 | ||
| [2007,2012) | 6.6 | 5.0 | 5.9 | 11.1 | 3.5 | 2.2 | 3.4 | 4.2 | 3.0 | 10.2 | 7.0 | 2.5 | 4.0 | 8.2 | 3.1 | 6.8 | 6.0 | ||
| [2002,2007) | 4.4 | 7.1 | 7.0 | 10.6 | 3.9 | 1.1 | 2.4 | 2.7 | 3.0 | 12.2 | 6.2 | 4.7 | 5.2 | 7.4 | 1.9 | 6.8 | 5.5 | ||
| [1997,2002) | 6.1 | 7.0 | 10.3 | 7.1 | 3.1 | 1.6 | 5.7 | 4.0 | 4.5 | 13.2 | 13.9 | 6.4 | 6.5 | 7.1 | 3.5 | 9.8 | 6.7 | ||
| [1992,1997) | 4.6 | 6.0 | 6.6 | 5.3 | 2.8 | 2.3 | 5.4 | 3.2 | 4.1 | 11.6 | 10.6 | 3.8 | 4.8 | 4.8 | 3.8 | 8.7 | 5.6 | ||
| [1987,1992) | 12.6 | 20.0 | 31.6 | 22.0 | 15.0 | 16.1 | 16.1 | 13.8 | 15.8 | 34.8 | 29.7 | 18.6 | 17.2 | 22.3 | 15.3 | 26.8 | 20.5 | ||
| Year | |||||||||||||||||||
| 2017 | 3.1 | 3.5 | 5.0 | 6.9 | 1.7 | 0.3 | 2.7 | 1.2 | 1.2 | 4.6 | 2.6 | 1.4 | 2.5 | 4.8 | 1.5 | 2.7 | 2.9 | ||
| 2016 | 3.1 | 4.2 | 3.3 | 4.0 | 0.3 | 0.3 | 1.8 | 1.2 | 1.2 | 5.6 | 4.9 | 2.6 | 3.3 | 2.8 | 1.2 | 3.8 | 2.7 | ||
| 2015 | 3.5 | 3.4 | 3.3 | 5.9 | 0.6 | 1.4 | 2.2 | 1.8 | 1.3 | 8.6 | 3.2 | 1.2 | 2.4 | 3.6 | 1.8 | 4.4 | 3.1 | ||
| 2014 | 3.0 | 4.6 | 2.6 | 6.9 | 0.4 | 2.8 | 2.6 | 1.9 | 4.2 | 8.7 | 4.4 | 6.0 | 5.0 | 4.3 | 2.4 | 5.7 | 4.2 | ||
| 2013 | 3.6 | 0.5 | 1.7 | 7.3 | 2.1 | 0.9 | 2.5 | 2.1 | 0.8 | 8.1 | 5.9 | 1.4 | 1.8 | 4.2 | 1.7 | 4.5 | 3.2 | ||
| 2012 | 3.6 | 2.0 | 2.9 | 7.5 | 0.8 | 1.9 | 4.0 | 1.5 | 3.3 | 5.0 | 3.7 | 1.5 | 2.3 | 4.7 | 2.9 | 4.1 | 3.6 | ||
| 2011 | 8.9 | 4.8 | 6.6 | 6.5 | 2.4 | 0.3 | 1.5 | 3.7 | 3.1 | 7.5 | 4.0 | 1.7 | 3.9 | 5.8 | 1.6 | 4.9 | 4.1 | ||
| 2010 | 2.1 | 0.9 | 1.1 | 14.5 | 3.3 | 1.8 | 1.9 | 1.2 | 0.8 | 15.7 | 7.8 | 3.4 | 2.5 | 8.3 | 1.8 | 8.0 | 5.7 | ||
| 2009 | 12.9 | 8.3 | 9.8 | 13.3 | 4.5 | 3.7 | 4.0 | 5.0 | 5.1 | 7.8 | 3.1 | 0.0 | 5.7 | 10.5 | 4.1 | 5.8 | 7.4 | ||
| 2008 | 1.4 | 1.7 | 5.6 | 10.1 | 4.7 | 2.3 | 8.7 | 3.7 | 3.8 | 11.8 | 22.5 | 7.9 | 4.4 | 8.1 | 4.4 | 11.3 | 7.5 | ||
| 2007 | 6.6 | 10.2 | 6.2 | 11.3 | 2.0 | 3.7 | 4.3 | 7.0 | 2.6 | 8.5 | 3.3 | 0.7 | 3.8 | 8.2 | 4.5 | 5.1 | 5.7 | ||
| 2006 | 4.6 | 11.7 | 5.3 | 13.6 | 4.2 | 0.0 | 1.7 | 3.0 | 3.8 | 12.4 | 9.4 | 6.1 | 6.8 | 9.2 | 1.4 | 7.4 | 6.6 | ||
| 2005 | 5.1 | 4.7 | 3.3 | 7.7 | 2.1 | 0.8 | 6.4 | 9.8 | 3.0 | 7.7 | 5.5 | 2.3 | 3.6 | 4.4 | 4.1 | 5.2 | 4.4 | ||
| 2004 | 5.6 | 6.6 | 13.0 | 15.1 | 7.6 | 2.8 | 1.8 | 2.0 | 0.5 | 9.9 | 4.9 | 2.5 | 4.9 | 12.0 | 2.3 | 5.0 | 6.2 | ||
| 2003 | 3.4 | 7.2 | 7.2 | 3.6 | 2.3 | 1.3 | 1.5 | 0.5 | 4.9 | 15.2 | 5.4 | 8.7 | 6.7 | 4.5 | 1.1 | 9.0 | 5.2 | ||
| 2002 | 2.9 | 5.9 | 7.5 | 10.3 | 3.5 | 0.6 | 1.3 | 1.3 | 1.8 | 15.5 | 5.9 | 4.8 | 4.4 | 7.3 | 0.9 | 7.4 | 4.8 | ||
| 2001 | 5.8 | 5.4 | 10.4 | 9.7 | 2.8 | 2.9 | 5.0 | 4.6 | 4.8 | 12.2 | 8.7 | 3.0 | 4.7 | 8.4 | 4.0 | 7.9 | 6.4 | ||
| 2000 | 9.5 | 13.1 | 8.4 | 4.0 | 4.2 | 1.0 | 5.8 | 2.9 | 4.5 | 16.8 | 6.4 | 9.1 | 10.5 | 5.5 | 3.1 | 9.6 | 6.7 | ||
| 1999 | 2.9 | 4.1 | 17.8 | 10.7 | 5.8 | 2.5 | 8.0 | 7.1 | 5.4 | 15.5 | 26.7 | 10.3 | 7.8 | 11.7 | 5.7 | 15.7 | 10.7 | ||
| 1998 | 2.7 | 5.7 | 8.9 | 2.2 | 0.0 | 0.0 | 4.4 | 1.9 | 2.2 | 5.1 | 7.4 | 1.3 | 3.0 | 4.0 | 1.8 | 3.8 | 3.2 | ||
| 1997 | 4.6 | 1.7 | 3.6 | 6.6 | 0.9 | 0.0 | 3.9 | 0.0 | 2.5 | 6.4 | 6.7 | 2.8 | 3.2 | 3.3 | 0.9 | 5.7 | 3.2 | ||
| 1996 | 4.5 | 6.4 | 6.7 | 3.5 | 0.9 | 3.0 | 3.9 | 5.9 | 2.0 | 7.8 | 5.2 | 4.6 | 5.2 | 3.4 | 4.2 | 4.5 | 4.3 | ||
| 1995 | 0.0 | 2.3 | 1.9 | 1.2 | 3.6 | 2.3 | 6.2 | 1.6 | 1.0 | 8.1 | 24.7 | 8.5 | 3.5 | 2.1 | 3.8 | 10.0 | 4.7 | ||
| 1994 | 7.8 | 10.4 | 5.9 | 5.8 | 0.7 | 4.3 | 4.4 | 3.4 | 4.5 | 11.5 | 5.0 | 0.0 | 5.5 | 3.4 | 4.1 | 7.7 | 5.3 | ||
| 1993 | 10.2 | 10.3 | 9.7 | 8.0 | 3.0 | 2.2 | 6.1 | 0.0 | 7.4 | 15.0 | 1.3 | 4.3 | 8.2 | 6.9 | 3.1 | 7.3 | 6.7 | ||
| 1992 | 4.6 | 1.9 | 10.6 | 11.7 | 8.3 | 0.0 | 6.9 | 2.4 | 7.0 | 20.3 | 15.8 | 0.0 | 2.2 | 10.4 | 3.1 | 14.1 | 8.0 | ||
| 1991 | 7.9 | 6.4 | 7.0 | 7.8 | 7.2 | 1.4 | 3.6 | 4.0 | 1.6 | 27.1 | 1.6 | 2.0 | 6.3 | 7.3 | 2.8 | 9.8 | 6.6 | ||
| 1990 | 6.5 | 6.5 | 33.3 | 11.2 | 8.4 | 15.3 | 9.7 | 9.9 | 3.4 | 9.5 | 17.8 | 15.8 | 8.2 | 17.1 | 11.6 | 9.8 | 11.4 | ||
| 1989 | 8.7 | 21.1 | 48.0 | 36.9 | 16.7 | 27.0 | 20.2 | 16.5 | 21.7 | 35.9 | 33.6 | 15.5 | 15.4 | 34.8 | 21.6 | 30.4 | 25.7 | ||
| 1988 | 22.4 | 33.6 | 30.9 | 24.6 | 14.2 | 15.4 | 21.6 | 13.7 | 24.3 | 41.7 | 36.9 | 15.0 | 24.5 | 22.0 | 17.0 | 34.1 | 24.3 | ||
| 1987 | 18.2 | 13.3 | 24.7 | 14.1 | 19.1 | 10.4 | 12.3 | 15.0 | 12.0 | 39.1 | 32.3 | 29.9 | 28.3 | 19.2 | 12.7 | 28.5 | 21.0 | ||
| 1986 | 7.7 | 2.6 | 15.1 | 8.3 | 8.5 | 0.0 | 0.0 | 0.0 | 3.2 | 21.6 | 37.9 | 5.7 | 5.1 | 11.0 | 0.0 | 20.7 | 9.8 | ||
| 1985 | 0.0 | 3.3 | 1.9 | 3.5 | 0.0 | 1.7 | 0.0 | 0.0 | 0.0 | 10.5 | 10.0 | 10.7 | 4.5 | 2.1 | 1.2 | 7.5 | 2.9 | ||
| 1984 | 0.0 | 0.0 | 0.0 | 0.0 | 0.0 | 0.0 | 0.0 | 0.0 | 3.7 | 5.9 | 6.5 | 8.8 | 6.1 | 0.0 | 0.0 | 5.4 | 3.4 | ||
| 1983 | 0.0 | 0.0 | 0.0 | 0.0 | 0.0 | 0.0 | 0.0 | 0.0 | 0.0 | - | 0.0 | 0.0 | 0.0 | 0.0 | 0.0 | 0.0 | 0.0 | ||
| 1982 | - | 0.0 | - | 0.0 | 0.0 | 0.0 | - | 0.0 | - | 0.0 | - | 0.0 | 0.0 | 0.0 | 0.0 | 0.0 | 0.0 | ||
Breeding data
Breeding records by month
Number of breeding records by breeding code and month, 2017 and all years| Breeding code | Jul | Aug | Sep | Oct | Nov | Dec | Jan | Feb | Mar | Apr | May | Jun |
|---|---|---|---|---|---|---|---|---|---|---|---|---|
| 2017 | ||||||||||||
| Breeding (BLA code) | 0 | 0 | 0 | 0 | 0 | 0 | 0 | 0 | 0 | 0 | 0 | 0 |
| Carrying Food | 0 | 0 | 0 | 0 | 0 | 0 | 0 | 0 | 0 | 0 | 0 | 0 |
| Copulating | 0 | 0 | 0 | 0 | 0 | 0 | 0 | 0 | 0 | 0 | 0 | 0 |
| Display | 0 | 0 | 0 | 0 | 0 | 0 | 0 | 0 | 0 | 0 | 0 | 0 |
| Dependent young | 0 | 0 | 0 | 0 | 0 | 0 | 1 | 1 | 0 | 0 | 0 | 0 |
| Faecal sac | 0 | 0 | 0 | 0 | 0 | 0 | 0 | 0 | 0 | 0 | 0 | 0 |
| Inspecting hollow | 0 | 0 | 0 | 0 | 0 | 0 | 0 | 0 | 0 | 0 | 0 | 0 |
| Nest building | 0 | 0 | 0 | 0 | 0 | 0 | 0 | 0 | 0 | 0 | 0 | 0 |
| Nest with eggs | 0 | 0 | 0 | 0 | 0 | 0 | 0 | 0 | 0 | 0 | 0 | 0 |
| Nest with young | 0 | 0 | 0 | 0 | 0 | 0 | 1 | 0 | 0 | 0 | 0 | 0 |
| On/leaving nest | 0 | 0 | 0 | 0 | 0 | 0 | 3 | 0 | 0 | 0 | 0 | 0 |
| All years | ||||||||||||
| Breeding (BLA code) | 0 | 0 | 0 | 1 | 0 | 0 | 3 | 2 | 2 | 0 | 0 | 0 |
| Carrying Food | 0 | 0 | 0 | 3 | 4 | 1 | 2 | 1 | 0 | 0 | 0 | 0 |
| Copulating | 0 | 0 | 0 | 0 | 0 | 0 | 0 | 0 | 0 | 0 | 0 | 0 |
| Display | 0 | 0 | 0 | 2 | 0 | 0 | 0 | 0 | 0 | 0 | 0 | 0 |
| Dependent young | 0 | 0 | 0 | 8 | 8 | 7 | 30 | 34 | 8 | 0 | 0 | 0 |
| Faecal sac | 0 | 0 | 0 | 0 | 0 | 0 | 0 | 0 | 0 | 0 | 0 | 0 |
| Inspecting hollow | 0 | 0 | 0 | 0 | 0 | 0 | 0 | 0 | 0 | 0 | 0 | 0 |
| Nest building | 0 | 0 | 0 | 4 | 1 | 1 | 1 | 0 | 1 | 0 | 0 | 1 |
| Nest with eggs | 0 | 0 | 0 | 0 | 0 | 0 | 1 | 0 | 0 | 0 | 0 | 0 |
| Nest with young | 0 | 0 | 0 | 1 | 0 | 3 | 3 | 1 | 0 | 0 | 0 | 0 |
| On/leaving nest | 0 | 0 | 0 | 0 | 2 | 0 | 6 | 1 | 0 | 0 | 0 | 0 |
Breeding records by year
Average number of breeding records per period by breeding code| Period | Breeding (BLA code) | Carrying Food | Copulating | Display | Dependent young | Faecal sac | Inspecting hollow | Nest building | Nest with eggs | Nest with young | On/leaving nest |
|---|---|---|---|---|---|---|---|---|---|---|---|
| All years | |||||||||||
| All | 0.2 | 0.3 | 0.0 | 0.1 | 2.6 | 0.0 | 0.0 | 0.2 | 0.0 | 0.2 | 0.2 |
| Previous years | |||||||||||
| All previous years | 0.2 | 0.3 | 0.0 | 0.1 | 2.7 | 0.0 | 0.0 | 0.3 | 0.0 | 0.2 | 0.2 |
| Previous 30 years | 0.3 | 0.4 | 0.0 | 0.1 | 3.1 | 0.0 | 0.0 | 0.3 | 0.0 | 0.2 | 0.2 |
| Previous 20 years | 0.4 | 0.1 | 0.0 | 0.1 | 2.1 | 0.0 | 0.0 | 0.2 | 0.0 | 0.2 | 0.2 |
| 10 year groups | |||||||||||
| [2007,2017) | 0.5 | 0.2 | 0.0 | 0.2 | 2.6 | 0.0 | 0.0 | 0.4 | 0.0 | 0.4 | 0.3 |
| [1997,2007) | 0.3 | 0.1 | 0.0 | 0.0 | 1.6 | 0.0 | 0.0 | 0.0 | 0.0 | 0.0 | 0.2 |
| [1987,1997) | 0.0 | 0.8 | 0.0 | 0.0 | 5.1 | 0.0 | 0.0 | 0.5 | 0.1 | 0.3 | 0.1 |
| 5 year groups | |||||||||||
| [2012,2017) | 0.4 | 0.2 | 0.0 | 0.4 | 2.2 | 0.0 | 0.0 | 0.2 | 0.0 | 0.4 | 0.2 |
| [2007,2012) | 0.6 | 0.2 | 0.0 | 0.0 | 3.0 | 0.0 | 0.0 | 0.6 | 0.0 | 0.4 | 0.4 |
| [2002,2007) | 0.6 | 0.0 | 0.0 | 0.0 | 1.4 | 0.0 | 0.0 | 0.0 | 0.0 | 0.0 | 0.2 |
| [1997,2002) | 0.0 | 0.2 | 0.0 | 0.0 | 1.8 | 0.0 | 0.0 | 0.0 | 0.0 | 0.0 | 0.2 |
| [1992,1997) | 0.0 | 0.2 | 0.0 | 0.0 | 1.2 | 0.0 | 0.0 | 0.0 | 0.0 | 0.0 | 0.2 |
| [1987,1992) | 0.0 | 1.4 | 0.0 | 0.0 | 9.0 | 0.0 | 0.0 | 1.0 | 0.2 | 0.6 | 0.0 |
| Year | |||||||||||
| 2017 | 0.0 | 0.0 | 0.0 | 0.0 | 2.0 | 0.0 | 0.0 | 0.0 | 0.0 | 1.0 | 3.0 |
| 2016 | 0.0 | 0.0 | 0.0 | 0.0 | 3.0 | 0.0 | 0.0 | 0.0 | 0.0 | 1.0 | 0.0 |
| 2015 | 0.0 | 0.0 | 0.0 | 1.0 | 4.0 | 0.0 | 0.0 | 0.0 | 0.0 | 1.0 | 1.0 |
| 2014 | 1.0 | 0.0 | 0.0 | 1.0 | 1.0 | 0.0 | 0.0 | 1.0 | 0.0 | 0.0 | 0.0 |
| 2013 | 0.0 | 0.0 | 0.0 | 0.0 | 3.0 | 0.0 | 0.0 | 0.0 | 0.0 | 0.0 | 0.0 |
| 2012 | 1.0 | 1.0 | 0.0 | 0.0 | 0.0 | 0.0 | 0.0 | 0.0 | 0.0 | 0.0 | 0.0 |
| 2011 | 1.0 | 0.0 | 0.0 | 0.0 | 0.0 | 0.0 | 0.0 | 0.0 | 0.0 | 0.0 | 0.0 |
| 2010 | 0.0 | 0.0 | 0.0 | 0.0 | 2.0 | 0.0 | 0.0 | 0.0 | 0.0 | 0.0 | 0.0 |
| 2009 | 0.0 | 0.0 | 0.0 | 0.0 | 3.0 | 0.0 | 0.0 | 1.0 | 0.0 | 1.0 | 1.0 |
| 2008 | 1.0 | 1.0 | 0.0 | 0.0 | 6.0 | 0.0 | 0.0 | 2.0 | 0.0 | 1.0 | 1.0 |
| 2007 | 1.0 | 0.0 | 0.0 | 0.0 | 4.0 | 0.0 | 0.0 | 0.0 | 0.0 | 0.0 | 0.0 |
| 2006 | 3.0 | 0.0 | 0.0 | 0.0 | 3.0 | 0.0 | 0.0 | 0.0 | 0.0 | 0.0 | 0.0 |
| 2005 | 0.0 | 0.0 | 0.0 | 0.0 | 4.0 | 0.0 | 0.0 | 0.0 | 0.0 | 0.0 | 1.0 |
| 2004 | 0.0 | 0.0 | 0.0 | 0.0 | 0.0 | 0.0 | 0.0 | 0.0 | 0.0 | 0.0 | 0.0 |
| 2003 | 0.0 | 0.0 | 0.0 | 0.0 | 0.0 | 0.0 | 0.0 | 0.0 | 0.0 | 0.0 | 0.0 |
| 2002 | 0.0 | 0.0 | 0.0 | 0.0 | 0.0 | 0.0 | 0.0 | 0.0 | 0.0 | 0.0 | 0.0 |
| 2001 | 0.0 | 1.0 | 0.0 | 0.0 | 3.0 | 0.0 | 0.0 | 0.0 | 0.0 | 0.0 | 0.0 |
| 2000 | 0.0 | 0.0 | 0.0 | 0.0 | 2.0 | 0.0 | 0.0 | 0.0 | 0.0 | 0.0 | 1.0 |
| 1999 | 0.0 | 0.0 | 0.0 | 0.0 | 4.0 | 0.0 | 0.0 | 0.0 | 0.0 | 0.0 | 0.0 |
| 1998 | 0.0 | 0.0 | 0.0 | 0.0 | 0.0 | 0.0 | 0.0 | 0.0 | 0.0 | 0.0 | 0.0 |
| 1997 | 0.0 | 0.0 | 0.0 | 0.0 | 0.0 | 0.0 | 0.0 | 0.0 | 0.0 | 0.0 | 0.0 |
| 1996 | 0.0 | 0.0 | 0.0 | 0.0 | 3.0 | 0.0 | 0.0 | 0.0 | 0.0 | 0.0 | 0.0 |
| 1995 | 0.0 | 0.0 | 0.0 | 0.0 | 0.0 | 0.0 | 0.0 | 0.0 | 0.0 | 0.0 | 1.0 |
| 1994 | 0.0 | 0.0 | 0.0 | 0.0 | 0.0 | 0.0 | 0.0 | 0.0 | 0.0 | 0.0 | 0.0 |
| 1993 | 0.0 | 0.0 | 0.0 | 0.0 | 1.0 | 0.0 | 0.0 | 0.0 | 0.0 | 0.0 | 0.0 |
| 1992 | 0.0 | 1.0 | 0.0 | 0.0 | 2.0 | 0.0 | 0.0 | 0.0 | 0.0 | 0.0 | 0.0 |
| 1991 | 0.0 | 0.0 | 0.0 | 0.0 | 0.0 | 0.0 | 0.0 | 0.0 | 0.0 | 0.0 | 0.0 |
| 1990 | 0.0 | 0.0 | 0.0 | 0.0 | 2.0 | 0.0 | 0.0 | 0.0 | 0.0 | 0.0 | 0.0 |
| 1989 | 0.0 | 2.0 | 0.0 | 0.0 | 15.0 | 0.0 | 0.0 | 1.0 | 0.0 | 0.0 | 0.0 |
| 1988 | 0.0 | 3.0 | 0.0 | 0.0 | 14.0 | 0.0 | 0.0 | 3.0 | 1.0 | 2.0 | 0.0 |
| 1987 | 0.0 | 2.0 | 0.0 | 0.0 | 14.0 | 0.0 | 0.0 | 1.0 | 0.0 | 1.0 | 0.0 |
| 1986 | 0.0 | 0.0 | 0.0 | 0.0 | 0.0 | 0.0 | 0.0 | 0.0 | 0.0 | 0.0 | 0.0 |
| 1985 | 0.0 | 0.0 | 0.0 | 0.0 | 0.0 | 0.0 | 0.0 | 0.0 | 0.0 | 0.0 | 0.0 |
| 1984 | 0.0 | 0.0 | 0.0 | 0.0 | 0.0 | 0.0 | 0.0 | 0.0 | 0.0 | 0.0 | 0.0 |
| 1983 | 0.0 | 0.0 | 0.0 | 0.0 | 0.0 | 0.0 | 0.0 | 0.0 | 0.0 | 0.0 | 0.0 |
| 1982 | 0.0 | 0.0 | 0.0 | 0.0 | 0.0 | 0.0 | 0.0 | 0.0 | 0.0 | 0.0 | 0.0 |
Distribution map
Distribution - 2017
This map shows the observed distribution of the White-naped Honeyeater for 2017.
The red circles are the grid cells where White-naped Honeyeater have been reported.
The transparency of the red circles indicate how many surveys sheets were submitted for that grid cell; the darker the red the more reliable the data. Of the 315 grid cells with reports, 83 had only one sheet; an example is grid number D22.
The size of the circle represents the reporting rate. The maximum reporting rate for White-naped Honeyeater was 100.0% (eg grid number D22) and the minimum was 0.2% (eg grid number K14). 
Distribution - all years
This map shows the observed distribution of the White-naped Honeyeater for all years.
The red circles are the grid cells where White-naped Honeyeater have been reported.
The transparency of the red circles indicate how many surveys sheets were submitted for that grid cell; the darker the red the more reliable the data. Of the 703 grid cells with reports, 55 had only one sheet; an example is grid number A5.
The size of the circle represents the reporting rate. The maximum reporting rate for White-naped Honeyeater was 100.0% (eg grid number A15) and the minimum was 0.1% (eg grid number S13). 
Breeding map
Breeding - 2017
This map shows the breeding distribution of the White-naped Honeyeater for 2017.
The red circles are the grid cells where breeding activity for White-naped Honeyeater have been reported.
The size of the circle represents the number of reports. 
Breeding - all years
This map shows the breeding distribution of the White-naped Honeyeater for all years.
The red circles are the grid cells where breeding activity for White-naped Honeyeater have been reported.
The size of the circle represents the number of reports. 